

The grid is the standard 13x13 starting-hand chart: pairs down the diagonal, suited hands above it, offsuit hands below.
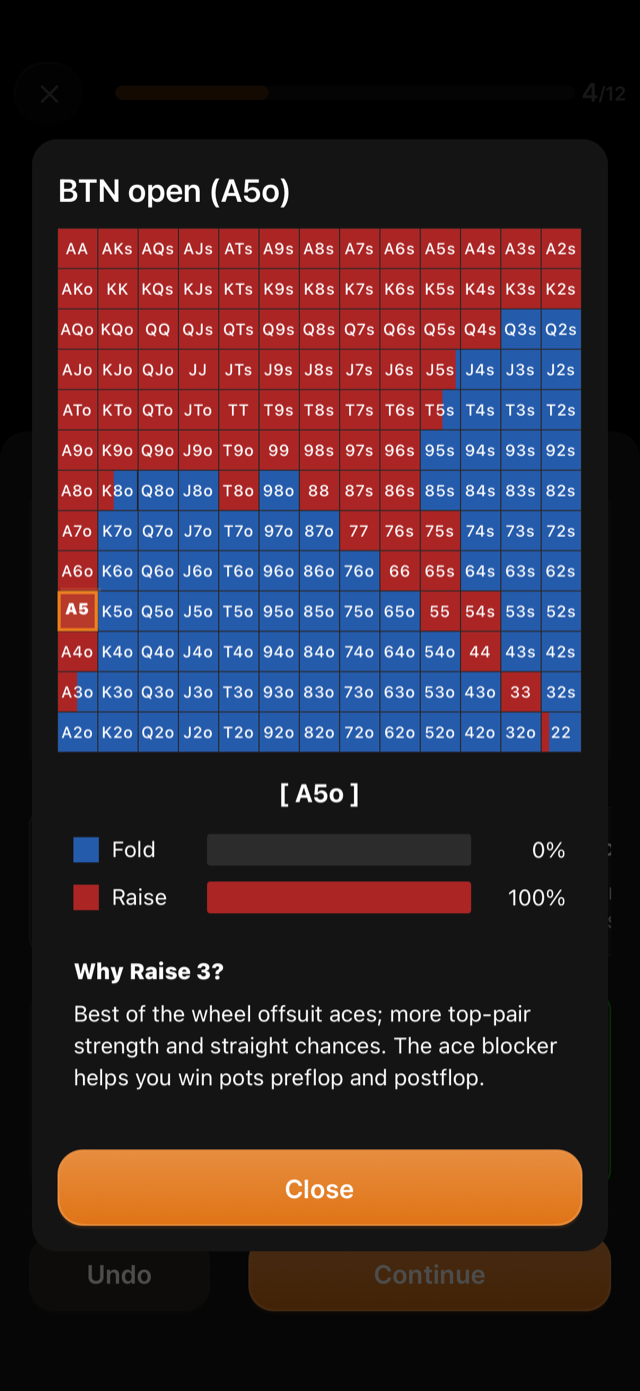
The colours
| Colour | Action |
|---|---|
| Blue | Fold |
| Green | Call |
| Red | Raise |
| Dark red | All-In |
The legend under the grid names whichever actions appear in the spot you are looking at.
Cells with more than one colour
A cell is filled in proportion to how often each action is taken with that hand. One third green and two thirds red means calling about a third of the time and raising the rest, which is a mixed strategy rather than an error in the chart.
This is the same information the trainer scores you on as a split, so the grid is the fastest way to understand why a spot had two correct answers.
Selecting a hand
Tap any square to select it. The selected hand is outlined in orange, and the panel below shows what that one hand does in this spot: the hand in brackets, then a bar per action with its exact frequency, for example Fold 0% against Raise 100%.
Under that is a written reason, headed with the action and its size, such as “Why Raise 3?” and the answer: “Best of the wheel offsuit aces; more top-pair strength and straight chances. The ace blocker helps you win pots preflop and postflop.”
Some hands do not have a note yet, and show “Hand description coming soon!” together with a link to Discuss this hand on PlusEV Discord.
The header names the spot the grid belongs to, for example “BTN open (A5o)”, so a chart screenshotted out of context still says what it is.
Where the grid appears
Two places: the Ranges tab, for any spot you want to look up, and the View Ranges button on the feedback screen after a hand, which opens the grid already set to the spot you just played.